
Digital Maturity Assessment 2023 – Section Four
Digital maturity varies significantly across the Scottish healthcare and social care landscape
Interrogating the assessment data by topic illustrates the degree of variance between the levels of digital maturity participating organisations have reported.
This fact may well give rise to potential strategic approaches to the issues at hand: Highly concentrated scores (e.g., Asset and Resource Optimisation, Digital Channels) show that organisations are at a comparable level of digitisation and may benefit from a centrally guided approach to continuing progress; A wider spread of scores (e.g., Skills & Competences, Remote and Assistive Care, Business and Clinical Intelligence) indicates disparity in degree and nature of digitisation, suggesting that a single approach may be ineffective. Polarised scores (e.g., Clinical Safety, Records, Assessments & Plans) indicate a mix of advanced and beginning stages of digitisation. Fostering knowledge sharing between those organisations may prove effective in supporting ongoing progress.
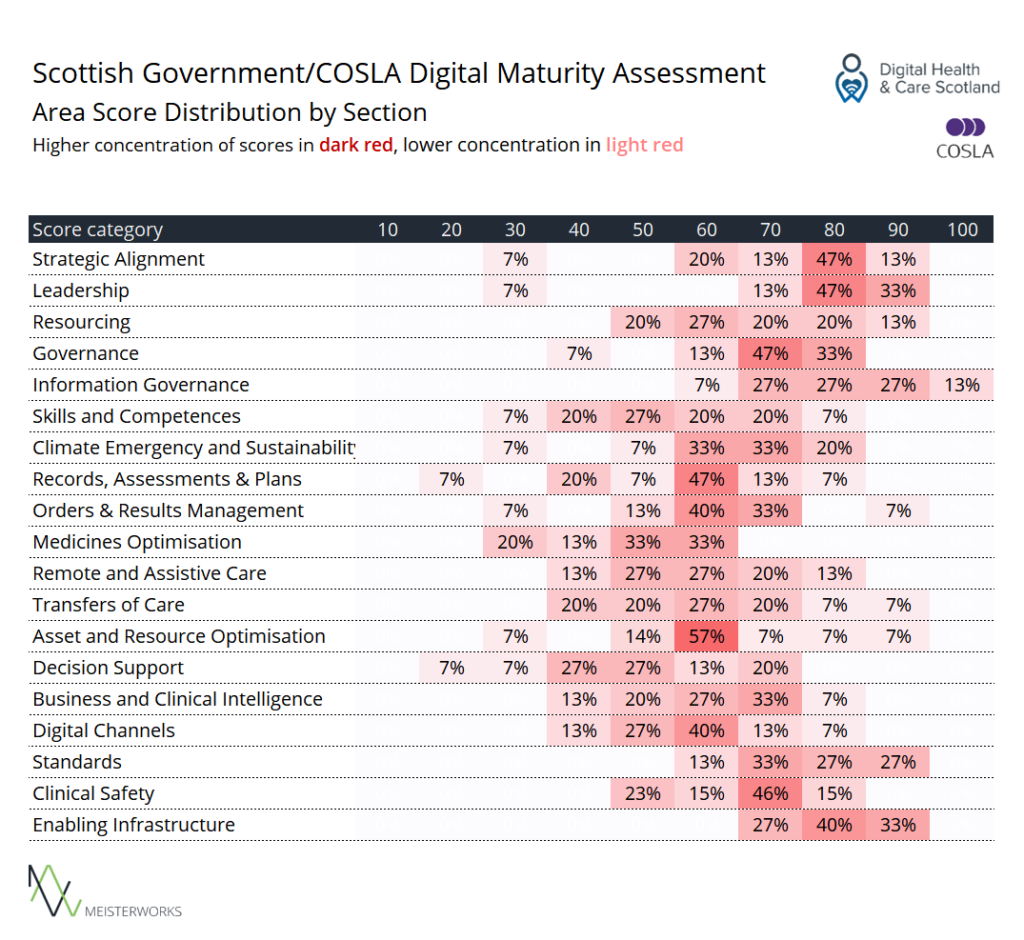
[A table reflecting the area distribution of scores across all sections in the assessment. The cells are coloured in shades of red to depict concentration of scores.]
For topics surveyed separately by service type within the digital maturity assessment, results varied by service type.
This is particularly remarkable since in many instances, different services in one locality are provided by the same organisation.
This finding may illustrate the difficulty healthcare and social care organisations across the country may be experiencing when rolling out digital solutions and processes across different care settings and services, and it certainly warrants further investigation.
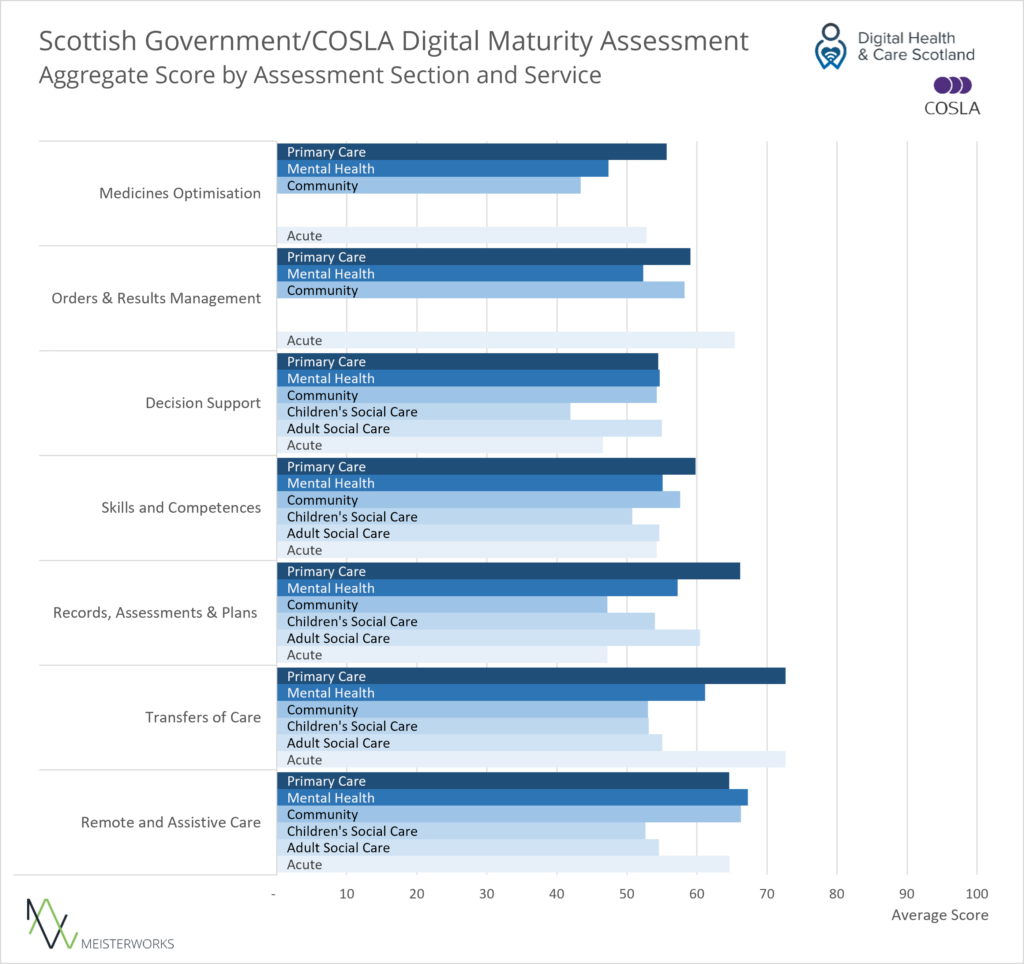
[A bar chart comparing average scores for different types of services.]
This trend appeared particularly pronounced for questions about the “reach” of digital practices (E.g., the degree of proliferation across the organisation or care system), where there were significant differences especially for topics such as Records, Assessments & Plans and Transfers of Care.
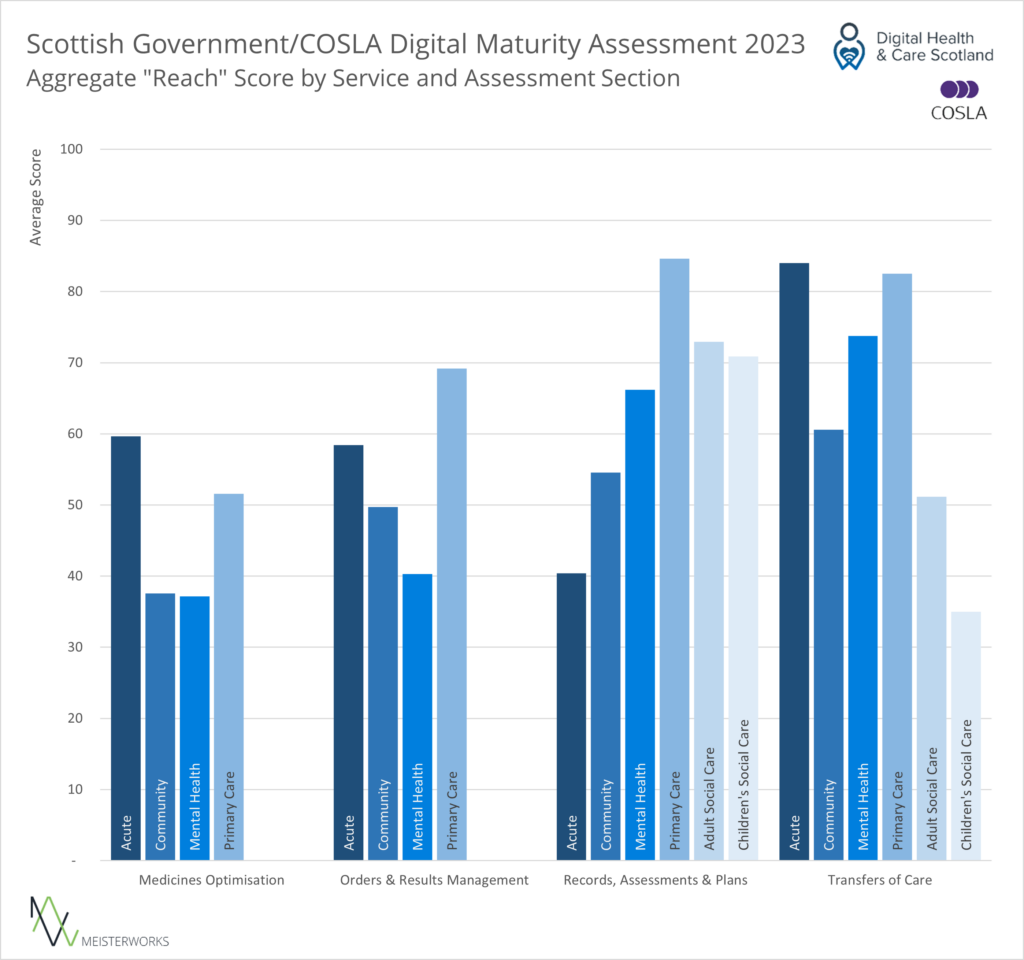
[A bar chart comparing average scores for ‘reach’ questions concerning the degree or proliferation of digital practices for different types of services.]