
Digital Maturity Assessment 2023 – Section Two
Top Level Findings
Overview
Looking at the data from the digital maturity assessment at theme level (e.g., aggregated from 20 sections into 3 categories – Readiness, Capabilities and Infrastructure), the national picture divides participating health and care systems into three groups: Leaders, Mid-Field and Followers.
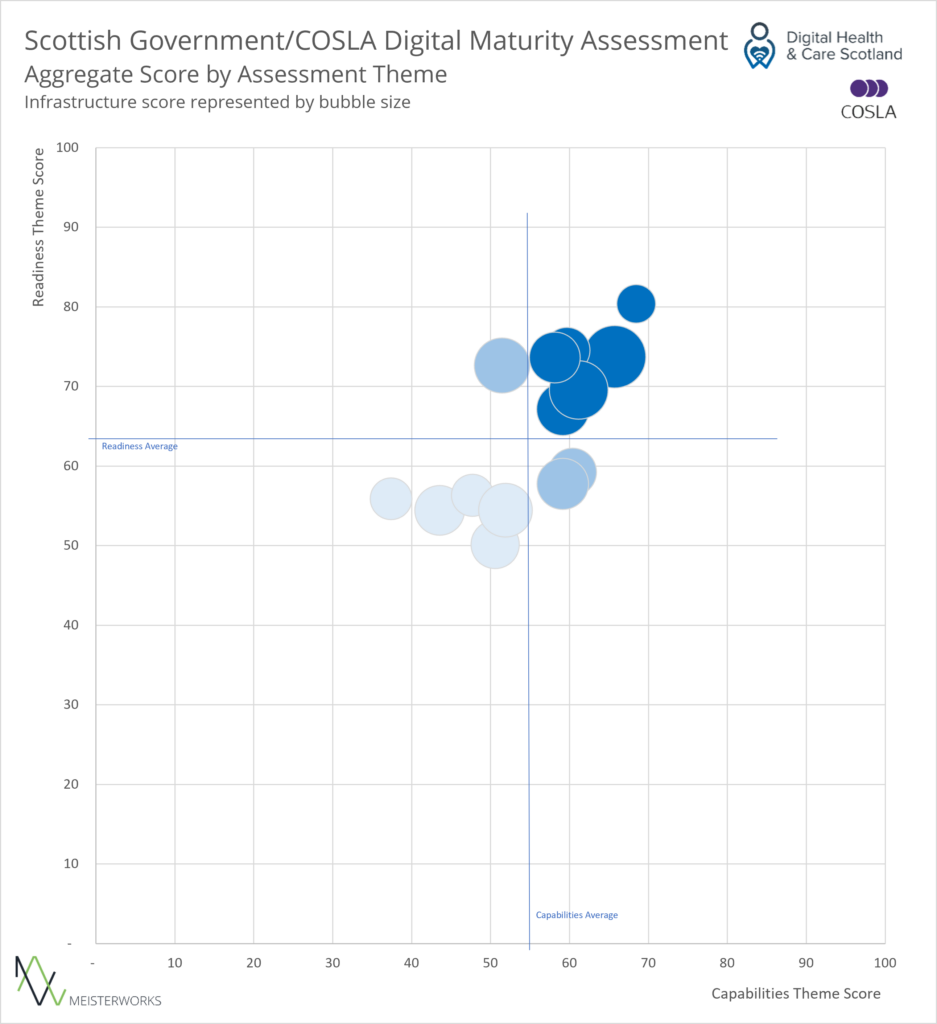
[A scatter chart showing aggregated results for each care system.]
Accordingly, roughly one third of the Scottish population is served by a healthcare and social care system we would class as Mid-Field or Follower.
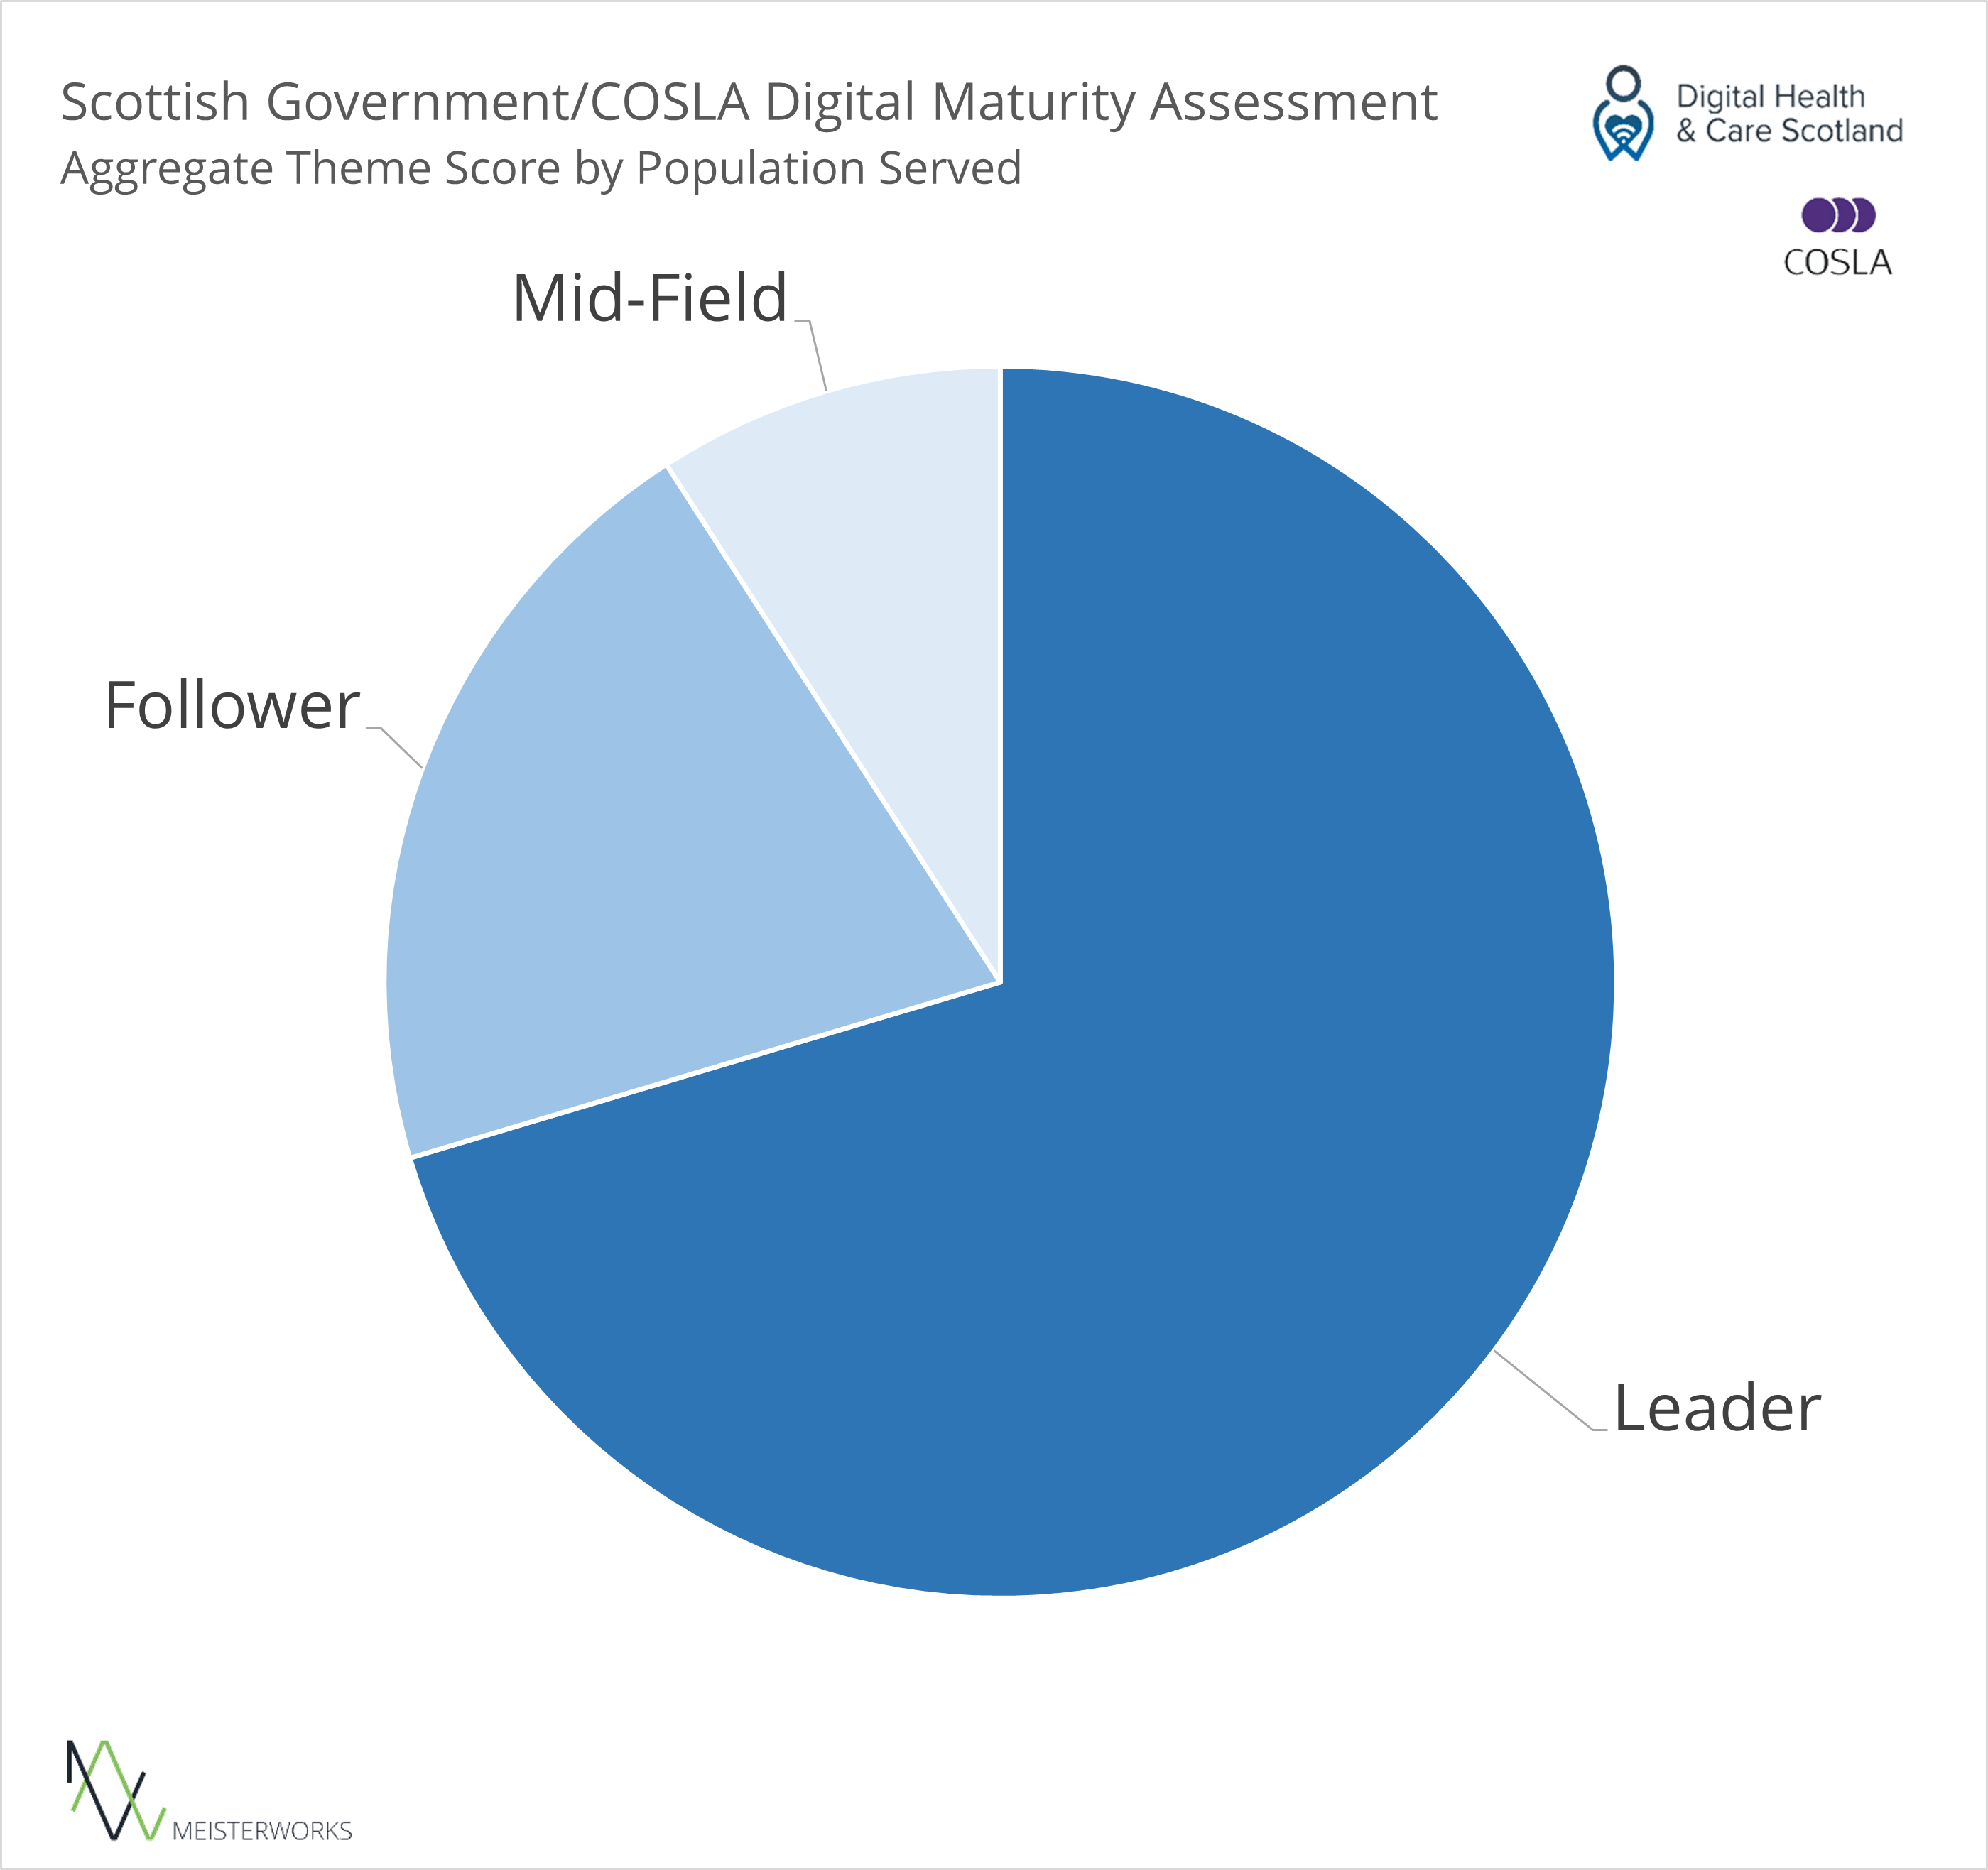
[A pie chart showing aggregated scores by population size affected.]
Further thought ought to be given to the fact that organisations serving more remote communities fared less well than those with urban communities.
Progress has been made
Compared like-for-like (e.g., comparing only questions that appeared in both the 2019 and 2023 assessments), progress has been made versus results from the previous assessment in 2019, particularly in the areas of Orders & Results Management, Transfers of Care, Medicine Optimisation and Remote & Assistive Care.
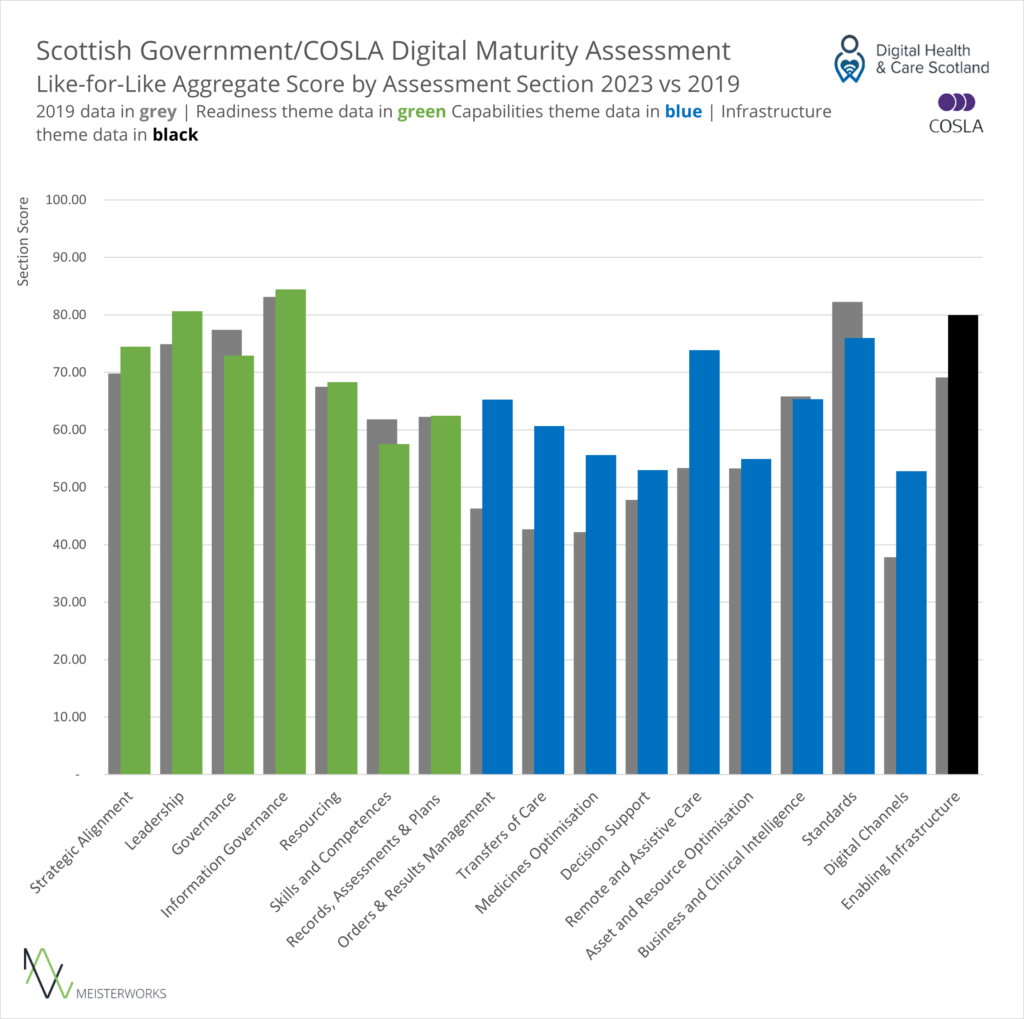
[A bar chart comparing the scores across all sections for the 2019 and 2023 assessments.]
Progress in the latter section was partially driven by the unique demands of the Covid crisis and therefore presents, except for the capability to provide care interventions by asynchronous means (E.g., via Email or Chat/Messenger) as fairly homogenous across the country.
Within Transfers of Care, Acute and Primary Care services are responsible for most of the progress made; other services contributed relatively little to improvements since the previous assessment in 2019.
When interrogating the assessment data by section or theme, some of this report will show a contrasting picture, because it compares historical 2019 results with what we consider “good” to look like today; of course, this goalpost has changed dramatically since 2019, and will continue to change as the digital capabilities of healthcare and social care in general evolves.
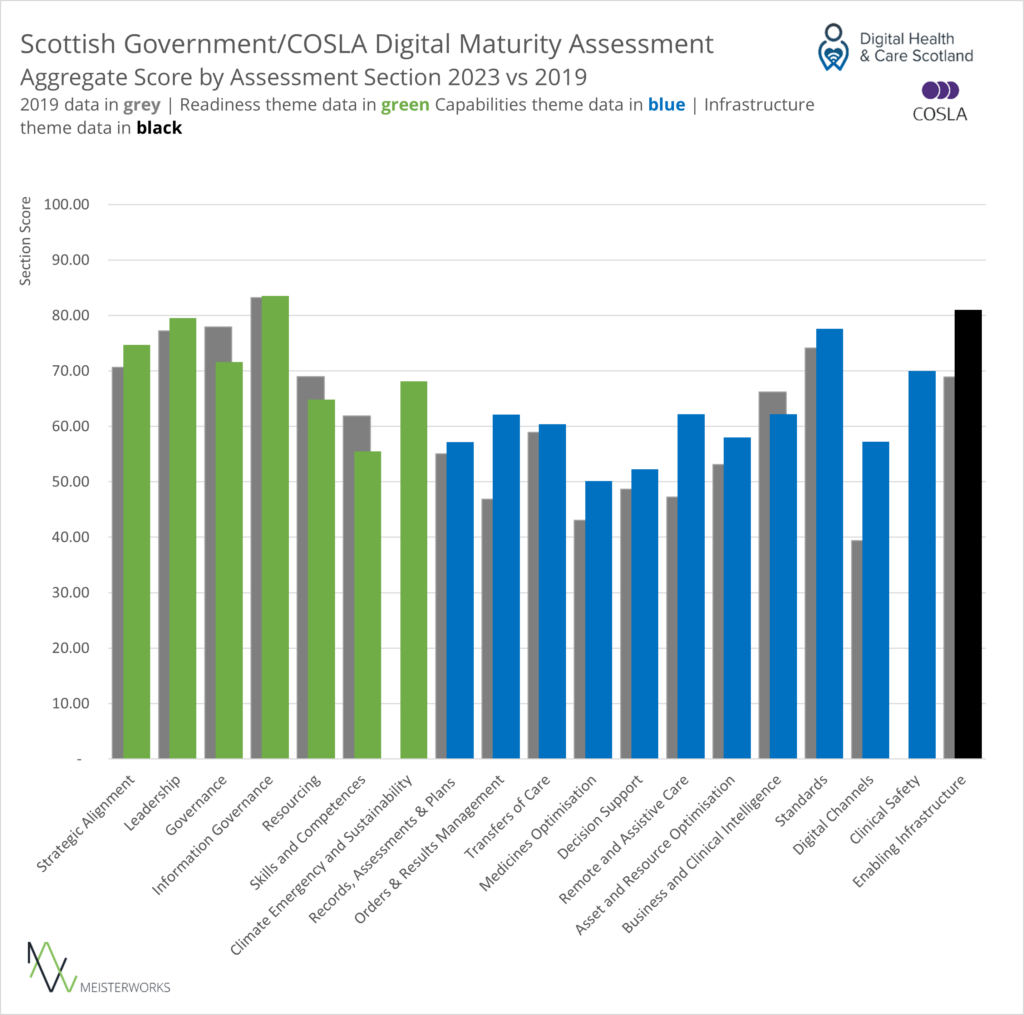
[This image shows a graph with summarized outcomes for each section from the digital maturity assessment for 2019 and 2023.]
There is evidence that the pace of change will continue in the near future; one indicator is that participating organisations report planned go-lives for new systems likely to enable better digital workplace integration, particularly in the areas of ePrescribing, Electronic Patient Records and Care Planning and Documentation.
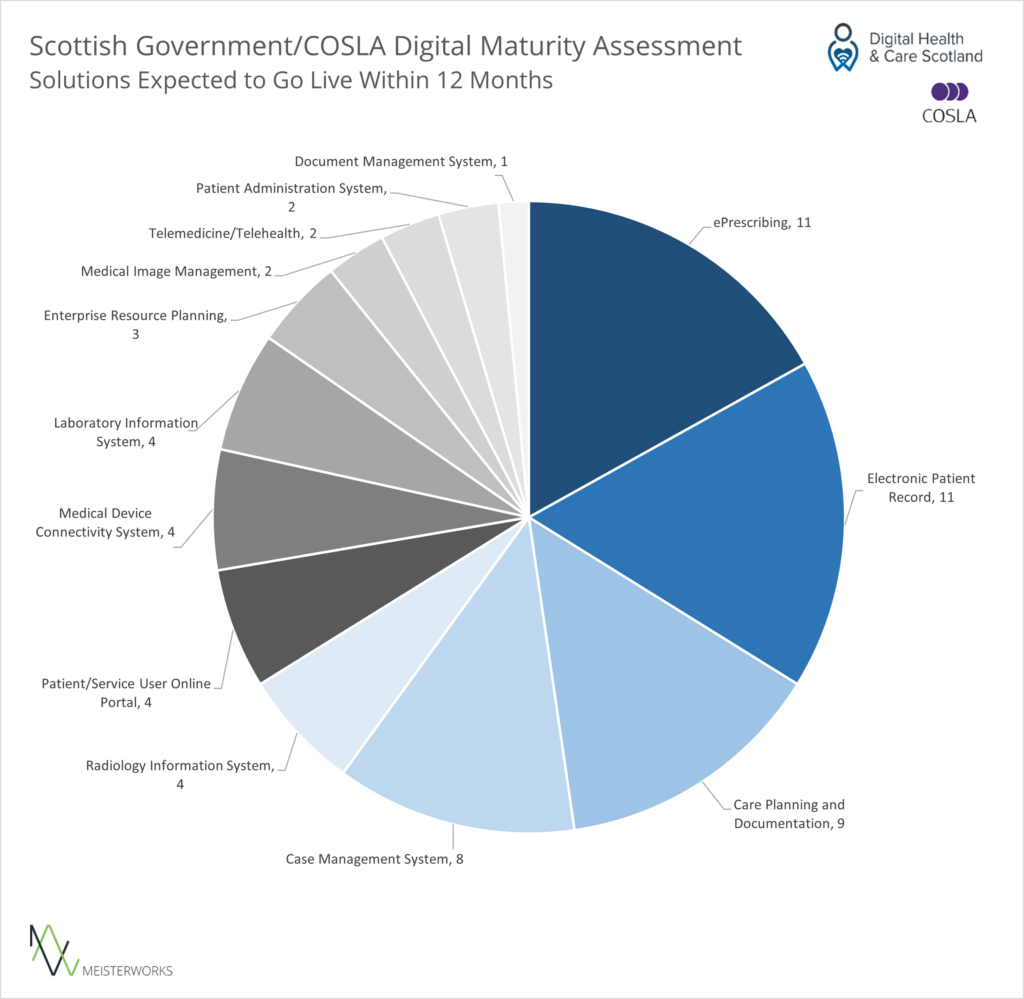
[This image shows a pie chart. The chart shows the types of systems planned for deployment. Types of systems are defined by their purpose.]